Transferring Clipper Card to new iPhone
I purchased a new iPhone and spent some time struggling to transfer my Clipper Card from the old phone’s wallet to the new phone. Figured I’d write-up a quick post for others that find themselves in the same position.
Step 1: Open Apple Wallet on your old phone, go into your Clipper Card’s settings, and remove the clipper card from the device. (This will show in red text, but don’t worry, your clipper funds are safe)
Step 2: Open Apple Wallet on your new phone and attempt to add a Transit pass. iOS will automatically identify that you have Clipper funds that aren’t linked to another device, and it’ll set-up the Clipper card on your new device, with no additional input from you
As a bonus, the “Service ID” that the new phone sets-up will match the “Service ID” of the card on the old phone.

My Journey to <50 BPM Resting Heart Rate
Throughout my life I never worked out much. I went to the gym once or twice a year, my outdoor runs were few and far in between (it was difficult to do a mile!). I would go skiing in the winter and hiking in the summer, but that was about it.
Thanks to my metabolism, I was never chubby - I even had light abs showing from time to time - but I wouldn’t be described as “fit” or “athletic” either. My upper arms were thin, and my face was just okay.
In October 2019, I decided to try my first ever Barry’s Bootcamp class. This was scary for me; I didn’t know the first thing about “going to the gym”. (Post-first-workout, I found myself examining a bottle in the locker room, deciding that it was lotion, rubbing it over my face, only to change my mind and decide that it must be face wash, and discreetly washing it off my face in case I was wrong so that others wouldn’t think I’m weird for washing lotion off my face.)
The first workout felt like death - I struggled to keep 7 MPH on the treadmill, and felt fatigued with the 15lb weights on the floor, but I felt such an intense sense of accomplishment after the class. Little did I know that my body would ache like there’s no tomorrow for the next two days - I considered going to the doctor when I couldn’t extend my arms all the way two days after the workout.
Thanks to the support of my friends who went with me, I kept going back, and as time went on I quickly saw my speeds on the treadmill increase, and my post-workout soreness diminish thanks to better stretching. I was so excited to see my first 11 MPH sprint, followed by my first 12 MPH, and ultimately hitting the fastest 12.5 MPH speed.
From October to December, my Apple Watch showed my resting heart rate dropping by over 10 bpm. Additional workouts combined with my “no-alcohol January” challenge saw my resting heart rate drop below 50 bpm in January. It was encouraging to quantify my fitness accomplishments via the Apple Watch as well as the speeds and weights I was hitting in the Barry’s “Red Room”.
What’s next for me?
I’ve began running daily during the coronavirus quarantine, and I’ve loved seeing my pace and distance gradually increase. I’ve set a goal of coming out of quarantine healthier than I went in, and I have no doubt that I’ll continue to be active on a daily basis. I only wish I had began working out earlier.
5 reasons to apply for Alpha Kappa Psi
Eccles Students, you know that it's crucial to "get involved" this semester - by why choose Alpha Kappa Psi? Here are five of my favorite reasons:
1) You'll form close friendships with a diverse set of students from many majors, multiple colleges, and a plethora of life experiences, ambitions, and talents. Best of all? These "brothers" are top-tier individuals who spent the past year devoted to starting our chapter from the ground up.
2) You'll gain experience in a startup-like environment, where you'll collaborate on projects as part of a committee, influence key decisions [even as a new member], wear many hats as the fraternity scales rapidly, and take on ownership of core pursuits & values to the fraternity. The market potential for AKPsi's impact is really quite infinite, and the potential for personal growth & development is enormous.
3) You'll meet AKPsi peers and alum throughout the country at leadership conferences and trainings - I myself connected with AKPsi peers when interning in a new state, and the friendships that ensued were incredible.
4) You'll receive hands-on experience mentoring your peers, and these people development skills are highly valued in the workplace.
5) The value you receive for the time and money you invest in the organization is among the highest ROIs at the University of Utah.
Business Book Recommendations
The Eccles School hosts an annual intern / alumni panel, and this spring, Alpha Kappa Psi partnered with Business Scholars Club to bring seven alumni & graduating seniors together who had accepted full-time offers to share their experience. This list is a collection of the books recommended by this year's panelists.
The panelists suggested these series of books to student attendees:
Talent is Overrated by Geoff Colvin
Outliers by Malcolm Gladwell
How to Win Friends & Influence People by Dale Carnegie
Zero to One by Peter Thiel
Work Rules by Laszlo Block
Blockbusters by Anita Elberse
#GIRLBOSS by Sophia Amoruso
The Tipping Point by Malcolm Gladwell
The Lord of the Rings by J.R.R. Tolkien
Takeaways from the Ethics Case Competition
I had the opportunity to compete in the Daniels Fund Ethics Case Competition, and this post reflects the experiences that stuck out to me and lessons I'll carry with me into the future.
I had the opportunity to compete in the Daniels Fund Ethics Case Competition this weekend, and I learned a few valuable lessons through the process that beg to be shared.
1) That “innovative” solution may not be so innovative
After many hours probing through the case, we noticed a minuscule detail that led us to a perfect, win-win outcome for the given scenario. We were so sure that no other team would consider this detail and that we had secured the competitive advantage of the perfect solution. Upon speaking to the judges after the competition, it turns out that seven other teams had made the same recommendation we did. So much for our “innovative” solution!
2) Build a recommendation that scales
Our ethics case involved a very specific scenario, and we made the mistake of approaching the case by seeking the optimal ethical, legal, and economic outcome for that specific scenario. We succeeded in finding the local maximum, but didn’t consider the global maximum. We should have focused on recommending a policy for the firm to implement for all future decisions rather than limiting our scope to the single instance of an issue.
3) Never forget to have fun
The competition was valuable from the perspective of exercising our public speaking and legal analysis skills, but I found the greatest joy by far to be the people I competed with. When you’re having so much fun that everyone knows you as “the team that laughed hysterically in their room for two hours” you know you’ve surrounded yourself with a good group of folks.

How to pick & pitch a stock
A seemingly infinite amount of research can be done when analyzing a stock. We can forecast thousands of factors to predict how they would impact a company, we can try to understand how hundreds of competitors interact in the industry, we think endlessly about the psychology of other investors in the marketplace and construct sensitivity analyses to quantify our level of certainty on any specific valuation. The reason I’m writing this post is to share a commonly used framework to evaluate a stock and build a stock pitch that can be used as a foundation for many further analyses.
I personally use a top-down approach when analyzing stocks, beginning with industry research, continuing with company research, and concluding with a valuation. Understanding the industry that a company operates in is fundamental to projecting its future success - some questions to ask are:
- What does the competitive landscape look like?
- What is the industry’s historic growth rate and how is its outlook?
- What are the barriers to entry?
- What are key drivers for industry growth, and what risks are present?
- What competitive advantages can firms leverage in this industry? I’m fond of IBISworld’s industry reports due to the incredible depth of their market research - the analysts explain industry regulation, M&A activity, economic drivers and key markets, and much more.
This phase of research serves to increase my awareness of the industry. If the industry seems to provide what an investor seeks (growth or stability), it’s time to begin researching the industry’s players and begin evaluating whether one will invest in the market leader or the underdog.
A fantastic resource to begin this next stage of research is a company’s Investor Relations website. All public companies will have an investor relations portal with links to quarterly earning calls, press releases, etc. The purpose of these portals is for management to explain the company roadmap and future plans to potential investors as clearly and comprehensively as possible, usually using graphics or photos for clarification. Investor relations resources can be complemented with 10-K and 10-Q filings from sec.gov (IR portals will likely link to these filings anyway).
SEC filings are standardized which makes them easy to compare between companies. Management will reflect on performance (commenting on any interesting occurrences in the financial statements) and explain their strategy for the future; this qualitative discussion is very helpful when trying to understand what happened in certain accounts. These filings are also easy to compare over the years to see if the company has historically met their goals for guidance provided to investors.
One method to expose trends in accounting statements is to crunch ratios. Is significantly higher inventory year-over-year normal with expanding sales or does it indicate an inventory management issue? Are margins increasing or decreasing? How has the capital structure changed? It’s important to think critically about these ratios and ask why they’re changing as they are.
It’s important to understand the key drivers behind the firm’s future financial performance and how strategic business decisions could impact these drivers - are significant sales made overseas where political regimes or currency risks could affect the business? Is there a monopoly in the suppliers for the firm’s top products which introduces a risk of increasing costs?
When I gain a comfortable understanding of a company’s products and strategy and how it stacks against competitors, it’s time to jump into valuation. Valuation is a culmination of the understanding that has been gained thus far in order to project future performance and quantify your assumptions into a target stock price. The current market stock price should theoretically reflect the assumptions of all other investors in the market - all of their projections should be priced in. If your assumptions vary from the market consensus, your valuation will either produce an upside potential indicating that the stock is undervalued, or you may show that a stock is overvalued.
There is lots of reading to be done on various valuation methods.
When it comes to a stock pitch, it’s all about summarizing all of the key findings into an appropriate length of time. The key bits of information to always include are the industry’s outlook, the firm’s competitive advantage within the industry, the key drivers behind the firm’s financial performance, and the reason why your analysis suggests a target price for the stock that’s different from the current market price for the stock.
Lessons from a week on Wall Street
My experience in New York had a profound impact on my educational goals and expected career path. Our hosts were very informative and inspirational across the board. Here are some key takeaways from our discussions.
I spent last week visiting fifteen companies in New York, New Jersey, and Connecticut to learn more about professionals working in all areas of finance. Along with eleven other students, I met with analysts, associates, managing partners and directors, SVPs, CIOs and CEOs from investment banks, venture capital firms, international corporations, boutique trading firms, consulting divisions, and personal wealth advisory enterprises.
The experience had a profound impact on my educational goals and expected career path. Our hosts were very informative and inspirational across the board. Here are some key takeaways from our discussions:
- As an intern, come in early, show intellectual curiosity in every aspect of your work, and offer to help with any project even if it is outside your sphere.
- Volunteer for the “bad” assignments at work. You will gain new experience and stand out!
- Financial modeling is a transferrable skill between many roles.
- Send a nice, specific thank-you letter if you’re going to send a thank-you.
- Consulting firms place value on extracurricular involvement and teamwork, and seek to hire empathetic individuals. High GPA is important to them, more so than it is to investment banks. Change-agility is the best trait for consultants.
- Consulting can be entered at any level, including entering as a partner later in your career.
- In interviews, the ability to quickly analyze a company using a measure like EBITDA given simple numbers is valuable.
- Set yourself up for success. Find a mentor and begin thinking ahead. Ask yourself questions like, “Do I have a consuming passion for finance?”
- Take the GMAT while still in school.
- Start a Roth IRA now.
These comments were each echoed by multiple professionals when expressing their recommendations for college students.
On the financial side, I learned that:
- Debt from private schools tends to default at a higher rate because of their lower entrance criteria.
- Canada’s cost of production for oil is around $60/barrel, whereas South Texas produces at around $30/barrel and Saudi Arabia’s cost is under $10/barrel.
- New banking regulation has placed capital requirements on commercial banks, but as the capital requirements don’t apply to hedge funds, a new form of risky lending by hedge funds has begun.
- Subprime lending levels are at the same level as 2007; not bad in and of itself, but we need to be cautious of creating leverage on leverage on leverage. Increased interest rates are necessary to put the brakes on an overheating economy.
- Shadow banking is gaining traction because capital is moving to unregulated areas.
- The greatest value of a publicly traded venture capital firm is permanent capital.
- A personal wealth management firm adds value beyond an actively managed portfolio, including managing a will, educating clients and setting risk tolerances, and purchasing securities not available in indices. These firms may hold some cash waiting for a big opportunity.
Till next time New York!

Portfolio optimization using the efficient frontier and capital market line in Excel
Assuming that markets are efficient and that the assets in a portfolio aren’t perfectly correlated, we can reduce the total variance of a portfolio at any given expected return by combining assets in various weights.
Imagine a graph with risk on the X axis (measured as standard deviation of the asset’s historical returns) and dividend-adjusted return on the Y axis (measured as an average of historical return). We can plot every possible combination of risky assets in a portfolio to find the best possible return at each level of risk (and lowest possible risk for each level of expected return), and the resulting curve would have a higher return for any given level of risk than any individual asset.
Modern portfolio theory attempts to maximize the expected return of a portfolio for a certain level of risk. The theory is that by diversifying through a portfolio of assets we can get a higher return per unit of risk than we can by holding an individual asset, and that by adjusting the weights of each asset in a portfolio we can create an optimal portfolio for each investor’s level of risk aversion. Assuming that markets are efficient and that the assets in a portfolio aren’t perfectly correlated, we can reduce the total variance of a portfolio at any given expected return by combining assets in various weights.
Imagine a graph with risk on the X axis (measured as standard deviation of the asset’s historical returns) and dividend-adjusted return on the Y axis (measured as an average of historical return). We can plot every possible combination of risky assets in a portfolio to find the best possible return at each level of risk (and lowest possible risk for each level of expected return), and the resulting curve would have a higher return for any given level of risk than any individual asset. We can then combine our efficient portfolio with a risk free asset to create a portfolio of portfolios which we can graph as the capital market line. The capital market line will lie tangent to the efficient frontier at the portfolio with the highest sharpe ratio and represent the highest expected return per unit of risk; this represents the market portfolio. By levering up the capital market line or combining the optimized portfolio with a risk-free asset, we can achieve expected returns higher than the efficient frontier at respective standard deviations.
I will demonstrate how the efficient frontier and capital market line can be modeled in Excel in order to produce efficient portfolios. Let’s say that we choose to construct a risky portfolio with all 30 stocks in the Dow Jones Industrial Average. Below is a screenshot of the closing price of the stocks each month over the past five years, along with an index of the S&P 500 to include in our model.

We can find continuously compounded monthly returns by taking the natural log of the closing price of each month / the closing price of the month prior. In Excel, this is entered as
=LN(Prices!B4/Prices!B5)
We create a table of continuously compounded monthly returns for the past five years, then compute the mean and standard deviation for each stock over this time horizon.
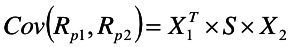
Covariance between returns on stocks is an important factor in this portfolio optimization because the value of diversification comes from assets that are not perfectly correlated; the greater the covariance, the more effectively we can diversify in order to reduce portfolio variability.
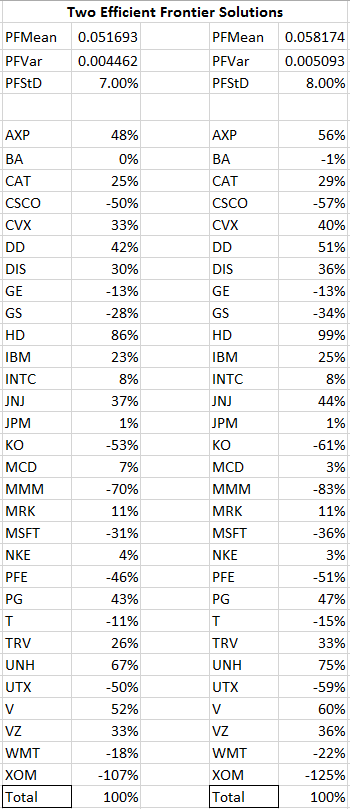
Covariance between returns on assets A and B is defined as
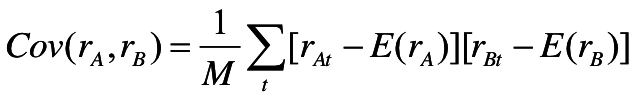
We must find the sum of every stock’s monthly change in price less its mean for the five-year monthly returns multiplied by every other stock’s monthly change in price less its mean for the five-year monthly returns. This number will then be divided by the number of months in our table. We can compute the covariance between every single stock in this model using matrix algebra - to do this we subtract the matrix of returns by the vector of means and multiply it by the transposed version of itself subtracted by the vector of means. In Excel, this is entered as
=MMULT(TRANSPOSE(B3:AF62-B64:AF64),B3:AF62-B64:AF64)/COUNT(A3:A62)
where the count command represents the number of monthly returns in my table.
The covariance table will appear as such:
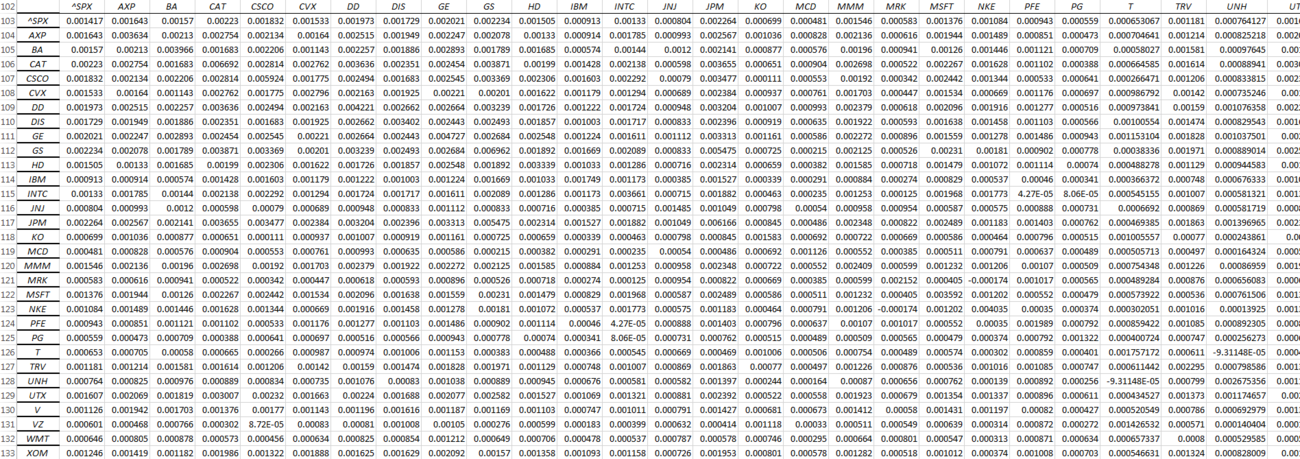
At this point we can construct a portfolio of arbitrary weights assigned to each stock. We then create cells to store the portfolio mean (vector of mean returns multiplied by vector of weights assigned to each stock to get a weighted average mean), portfolio variance (the vector of weights multiplied by the covariance matrix multiplied by the vector of weights), and portfolio standard deviation (square root of variance). Depending on the way I structure my spreadsheet, I may need to transpose vectors in order to multiply my matrices.
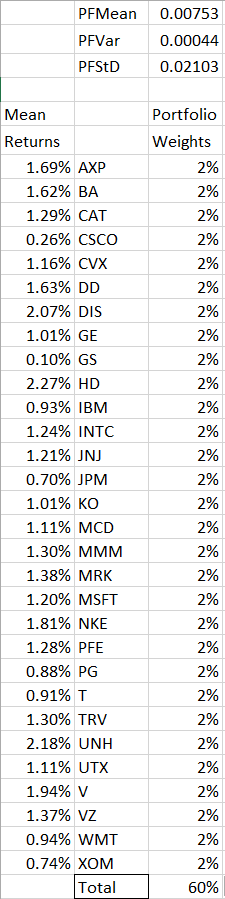
Upon constructing this part of the spreadsheet I can begin to find points on the efficient frontier. If we find two efficient portfolios, we can plot the entire efficient frontier by varying the weight of capital applied to each of these portfolios. I can use Excel’s Solver to find two efficient portfolios; the way I choose to do this is to maximize the value of the portfolio mean by changing the portfolio weights, subject to the constraint of the weights adding to 100% and a portfolio standard deviation of 7%. I then repeat the process for a constraint of portfolio standard deviation equal to 8%.
Allowing portfolio weights to be negative represents taking a short position in a stock.
I can copy and save the values of the portfolio weights, mean, variance, and standard deviation after each iteration of running Excel’s Solver to the side of my worksheet.
I can use a linear combination of my two efficient portfolios to effectively calculate the portfolio mean and standard deviation of every efficient combination of assets. I will arbitrarily pick a weight for one of my efficient portfolios within this new portfolio of portfolios and enter it into a cell in Excel, then find a weighted average return for my new portfolio. The covariance between these two efficient portfolios is defined as
effectively multiplying the vector of weights for the first efficient portfolio by the covariance matrix of all stocks by the vector of weights for the second efficient portfolio. The standard deviation of the new portfolio of efficient portfolios will simply be the square root of this covariance.
At this point we can create a data table using Excel’s What-If Analysis to easily calculate the standard deviation and mean at many various weights of portfolio A with respect to portfolio B. The left column here represents the weight applied to my portfolio with standard deviation 7%, where the weight of my portfolio with standard deviation 8% equals 1 - portfolio of StDev 7%.
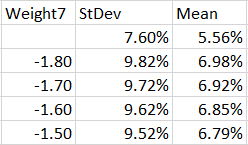
[Data table continues downward until Weight7 = 10]
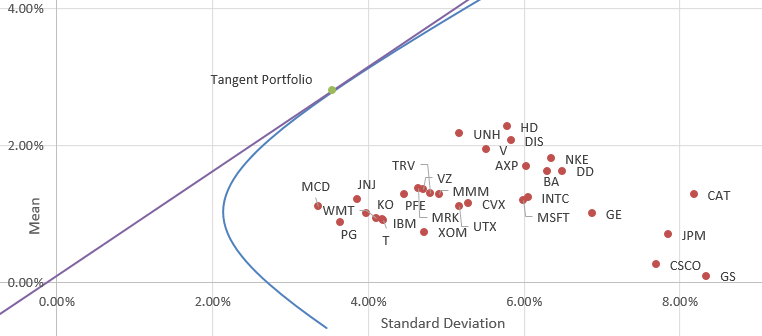
Plotting this data table as a scatterplot or scatter with smooth lines allows us to visualize the efficient frontier. Every point on the positively sloped region of this curve represents a portfolio that will offer the highest expected return per unit of risk.
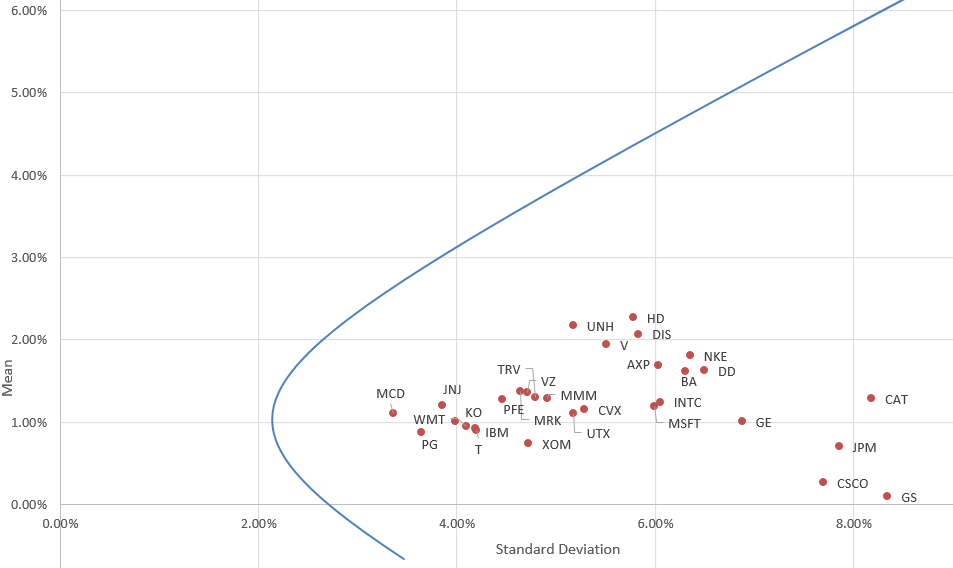
This efficient frontier is computed based on two efficient portfolios, and if we were constructing a portfolio based on these findings we would be curious to see what weight to apply to each stock in this portfolio at any given point. This is easy to compute by creating a matrix with a column for each stock and a row for each weight of portfolio A used in the data table, then multiplying the weight of portfolio A by the respective weight of stock A in portfolio A and adding this to the weight of portfolio B (1 - weightA) multiplied by the respective weight of Stock A in portfolio B, and completing the entire matrix with such a formula. Alternatively, we can use Excel’s Solver to solve for our initial weight-seeking task with the constraint of a mean or standard deviation equal to a certain value to find the optimal portfolio weights at that efficient portfolio.
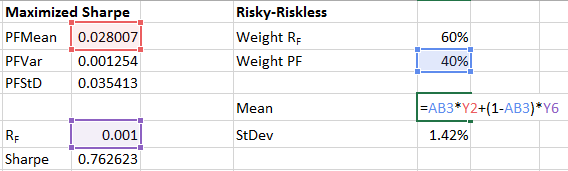
We can maximize the sharpe ratio [(portfolio mean - risk free rate) / portfolio standard deviation) to create a portfolio with the best historical risk-adjusted performance. The CAPM model allows us to combine the efficient portfolio with a risk-free asset to do attain a higher expected return than the efficient frontier. We do this by combining the risk free asset with the tangent portfolio containing all of our assets (this portfolio would represent the cap-weighted market portfolio). If we construct a portfolio at this point and keep the individual asset weights constant, we can lever up to reach a higher expected return or combine this portfolio with a risk free asset to a lower standard deviation; all the possible combinations of the risky portfolio and risk free asset make up the capital market line.
The CML’s slope is that of the sharpe ratio, thus indicating the best expected return per unit of risk, which will be superior to any portfolio on the efficient frontier. The CML also lies northwest of the efficient frontier, representing lower risk and/or higher expected return. The point of tangency represents a portfolio of 100% of the risky asset, whereas portfolios on the CML with a higher expected mean represent leverage and portfolios on the CML with a lower standard deviation combine the risky portfolio with a risk-free portfolio.
To model this in Excel, we first find the tangent portfolio by maximizing the sharpe ratio subject to the constraint of all portfolio weights adding up to 100% using Excel’s solver. We then construct a risky-riskless portfolio by combining the tangent portfolio with the risk-free asset in at an arbitrary weight. We find the mean and standard deviation of the portfolio at this arbitrary weight. Since the standard deviation of the risk-free asset is zero, we can simply multiply the tangent portfolio standard deviation by the tangent portfolio weight to find the standard deviation of the risky-riskless portfolio.
We can then create a data table as before.
When graphed, this purple line represents the capital market line. Any rational investor would hold a portfolio of weights in proportions to the tangent portfolio constructed, then combine this portfolio with a risk-free asset according to their risk tolerance in order to generate expected returns above the efficient frontier.
The S&P 500 landed at the following spot for this data set.
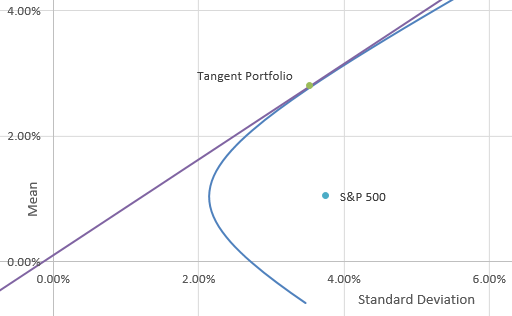
Using such a model would help an investor who believes in efficient markets construct an optimal portfolio exposed to the highest expected return at the lowest variance. Limitations can be placed on this portfolio when using Excel’s solver if needed, for example to limit the maximum investment in any individual stock or disallow short selling.
A better method for training
I was a Manufacturing Operations intern during my sophomore summer, and in my time at the firm I created a an automated manufacturing tracking tool based on Google Sheets. I found that I needed to train a few team members on spreadsheets as I handed off my work, and this post reflects my thoughts on those training sessions.
When I first started my internship this summer, production efficiency for the teams I was working with was calculated by recording output on a whiteboard and crunching numbers on a calculator every 15 minutes. I developed an automated tool to track production in a quicker, more accurate, and more precise way using Google Forms and Spreadsheets. As the internship came to a close, my primary goal became ensuring that the system I developed would be sustained when I'm gone.
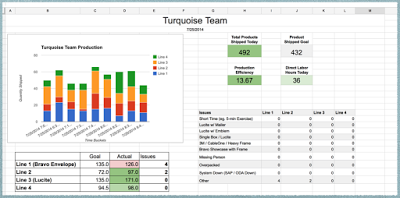
In teaching how my spreadsheet works, I discovered that very few people had a working knowledge of Excel! I decided to create a development plan for one of the natural leaders [we'll call her Kate] in the team. She had never before used Excel and wasn't too familiar with computers in general; I wanted to create a quick, effective training on spreadsheets and the inner workings of the spreadsheet I had created. My development plan took a **vastly different approach** than most Excel training programs.
Day 1: I trained Kate using Excel 2010 on Windows.
Day 2: I trained Kate using Excel 2011 on Mac.
Day 3: I trained Kate using Google Spreadsheets
Every training program I've seen to date focuses on teaching an individual how to use a specific software product, but it turns out this is an *extremely short-sighted* way to teach students or employees - and it's not necessarily easier.
At the University of Utah School of Business, all business majors are taught how to operate Excel for Windows in a class where the training software walks you through every single click. This creates a class where people are scared to get out of the comfort bubble of Excel 2010/2013 (depending on which year you took the course). People steer clear of Excel on Mac or Google Spreadsheets because a few technicalities are slightly different, not to mention people's fear of using Numbers on iPad.
Software changes rapidly - thus we should be focusing on the *fundamentals* of what we're teaching over the software-specific layout and functions.
By switching the software Kate used every day of the training, she picked up on the similarities between each software and learned the principles of working with spreadsheets rather than a specific process for an individual software title. We went over the layout of each software but didn't train on anything specific to that layout - I would say "Now do ____ in the spreadsheet" and she would find that function wherever it may be located. She would be equally comfortable using any platform for spreadsheets, which is crucial in our world of rapidly changing technologies.
Best of all - Kate learned spreadsheets incredibly quickly, and after three one-hour sessions she went from never having used Excel to knowing:
- Formatting spreadsheets with merged cells, table borders, colors, sizes, etc., including conditional formatting which references other cells.
- How to reference cells and build formulas to reference cells across sheets, as well as using formula help menus.
- Inserting charts, editing chart ranges, and customizing charts.
- Sorting data and calculating frequencies.
...all while being able to work with either of the three software titles we trained in. The cross-platform, high-level training was very effective.
It would be wise to begin to teach the *principles* of the tools we're training on rather than how to use the specific tools. We need to teach the *core competencies* rather than specific tools. We need to develop *people who can adapt* to changing tools rather than clinging to their comfort zone.
tl;dr: Let's start training people on the foundational principles of the tools we use rather than specific tools we want them to use today.
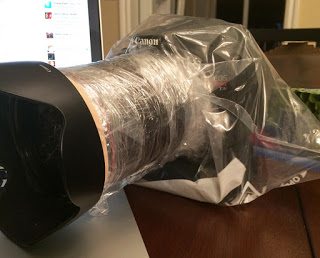
Protecting a DSLR at a Festival of Colors
There are a ton of posts that'll have you scared to take a DSLR to to a color festival or run. I want to share my own color-proof seal for the Holi Festival of Colors in Utah that managed to keep my DSLR completely clean for under $15.
This was my first blog post, and it was picked-up and reposted by PetaPixel!
There are a ton of posts that'll have you scared to take a DSLR to to a color festival or run. I want to share my own color-proof seal for the Holi Festival of Colors in Utah that managed to keep my DSLR completely clean for under $15.
Shopping List
- Lens Filter (I chose a cheap $10 lens filter)
- Plastic Wrap
- Gallon Ziplock Bags (I chose Freezer since it's thicker than Storage)
- Gaffer Tape
- Rubber Bands
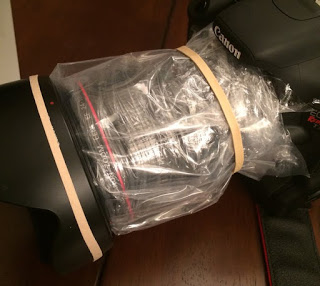
I wanted to protect the entire camera from all color particles and leave only the cheap lens filter and lens hood exposed to color. I experimented for hours to find the best way to seal my gear, and this is what I came up with -
Take the lens hood off and tighten the lens filter onto the lens. The filter adds a few millimeters to the height of the lens, and you'll want to take a piece of plastic wrap (the length about 1.5x the circumference of the lens, the width being about the size of the lens) and wrap it very tightly in a clockwise fashion right around the frame of the lens filter.
Take a tight, flat rubber band (about the width of the lens filter frame) and snap it over the plastic wrap right where the lens filter frame is. This rubber band keeps this plastic wrap in place, and the plastic wrap makes sure that any color particles coming toward the front of the lens won't be able to make it anywhere near the front element of your lens (they'll get the cheap lens filter dirty but can't make it near the grooves of the lens filter).
Grab one of the gallon sized "Freezer" Ziplock bags and cut a square from one side of the bag. Take this square of Ziplock material and wrap it tightly around the rubber band.
Now it's time to carefully screw the lens hood into place over the plastic wrap and Ziplock. The Ziplock "Freezer" bags are tough and shouldn't tear, but if it does begin to stretch and tear it may be a good idea to give the lens filter 90° of clockwise motion before its maximum tightness, complete the steps above, then screw the lens hood on while simultaneously tightening the lens filter.
Since I wanted to be extra careful, at this point I snapped an extra rubber band over the existing rubber band (now located inside the lens hood), and I stuffed strips of gaffer's tape to fill the space between the lens filter and lens hood.

At this point, any color particles thrown at the front of the camera will hit the lens filter but have no way to get behind the lens filter or anywhere near its grooves.
I chose to set AutoFocus on and leave my lens at 24mm for the entire event, so I tightly wrapped the lens barrel with the initial plastic wrap (the one gripping the lens filter) as a base layer, a few layers of plastic wrap over that, and the Ziplock (being held down by the lens hood) as the final layer.
Now that the lens is protected, it's time to work on the DSLR body.
Grab another gallon-sized Ziplock bag and cut the entire bottom away. You'll end up with a large ziplock with absolutely no bottom, and you can fit the entire DSLR body and camera grip into that.
When the bottom of the Ziplock is closed, the bag should reach near the front of the lens barrel. This is the point where I pulled out the gaffer tape and tightened the Ziplock over all of my previous plastic wrapping. This creates a particle-proof seal for the entire camera, and to be extra safe you can see that I did more wrapping on top.
You can double-bag the DSLR body if you feel that the Ziplock seal may be a point of weakness. I never opened the Ziplock seal once at the event (the grip and large memory card provide enough battery and capacity for a day of shooting). In retrospect, I'd also put some gaffer tape over the On/Off switch since I could feel it pushing into the Ziplock while I photographed the event.
My color-proof sealing worked flawlessly at the Festival of Colors. I stood at the center of the crowd and got color thrown right at the lens...

(you can simply blow on the lens and the color will fly away, no need to carry microfiber cloths) yet not one spec of color reached the lens or DSLR body.